|
Since ELF and VLF studies fall in the 300 Hz - 30 kHz, they line up well with the frequencies of audio recognition. Hence, we can listen to the data stream as if it were audio. Here's a selected segment of data taken from Stanford, California. (To listen, click here.) NOTE: To listen to audio, you must install the appropriate additions to your browser.
|
|
Another way of presenting VLF data is in the form of a spectrogram, and here is an example of the same data in this form: 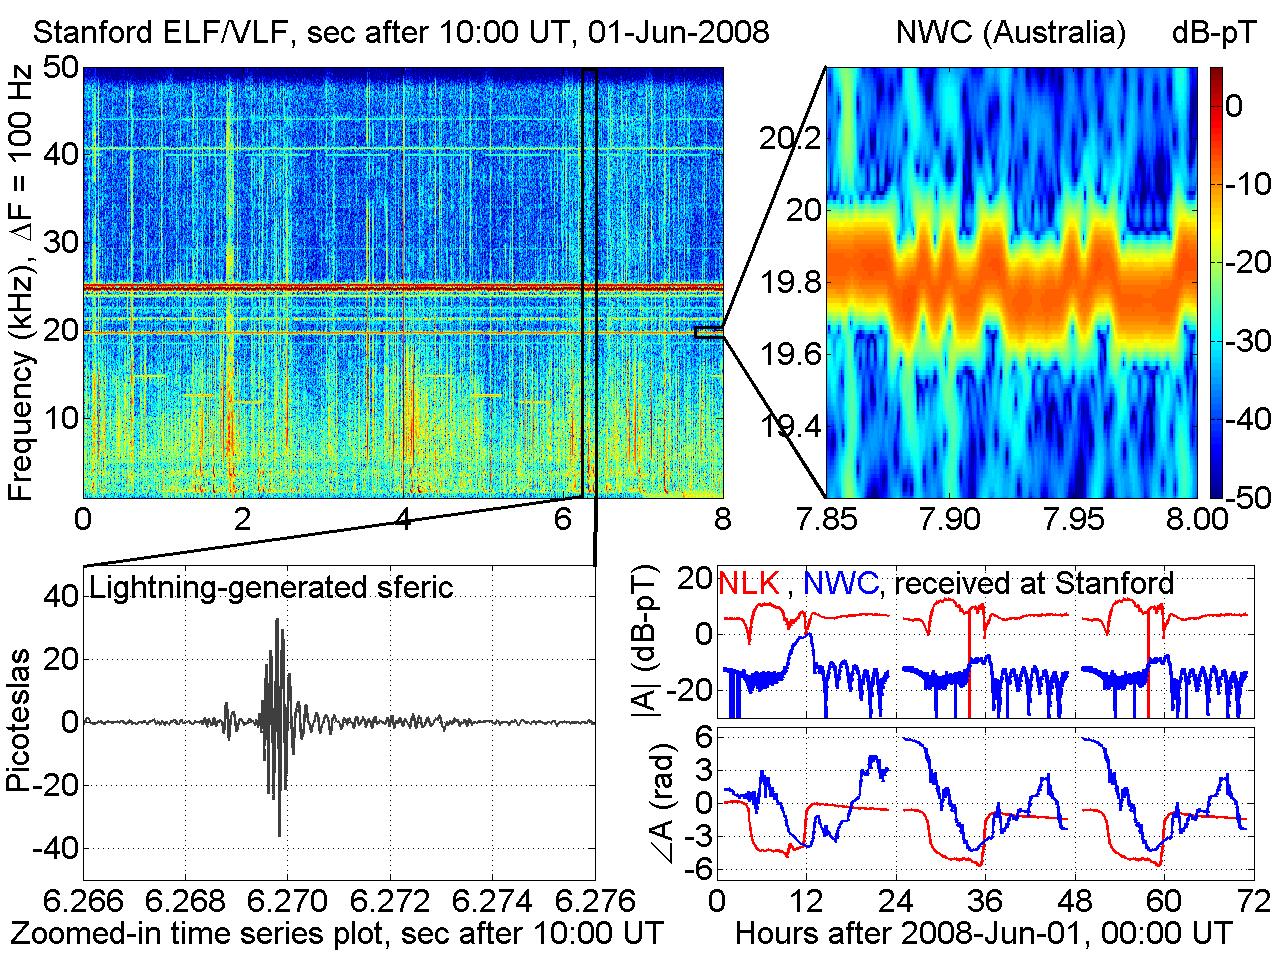
The data are divided up into small time segments, in this case 10 ms long. A Fourier transform is performed on each segment, and the color shows the magnitude of the signal. The numerous vertical lines on these spectrograms are radio atmospherics, or `sferics', originating from lightning strikes, which could be anywhere in the world. Lightning emits short bits of impulsive radiation which can observed be at global distances from the source since they are guided by the Earth-ionosphere waveguide. These correspond to the "click" and "tweek" sounds in the audio sample. A zoom-in a radio atmospheric is shown in the bottom left panel. There are also a set of short horizontal lines between 10 and 15 kHz. These are the `Alpha' navigation beacons. The solid horizontal lines between 18 and 30 kHz are VLF transmitter signals, although they are too high in frequency to hear in the audio. These transmitter signals are nominally used for communications. The top right panel shows a zoom-in of a transmitter called NWC, in Australia, which is clearly detected at Stanford, and the communication signal can be seen as up and down modulation of the frequency. However, these transmitter signals act as a diagnostic of the lower ionosphere, since their propagation to long distances is dependent on ionospheric reflection. The bottom right panels shows an example of two of these VLF transmitters tracked at Stanford for a 3-day period. Both the amplitude (top) and phase (bot) of the signal show a clear daily variation, reflecting the drastic changes to the lower ionosphere from daytime to nightime. This is an example of ionospheric remote sensing using VLF transmitter signals. |